


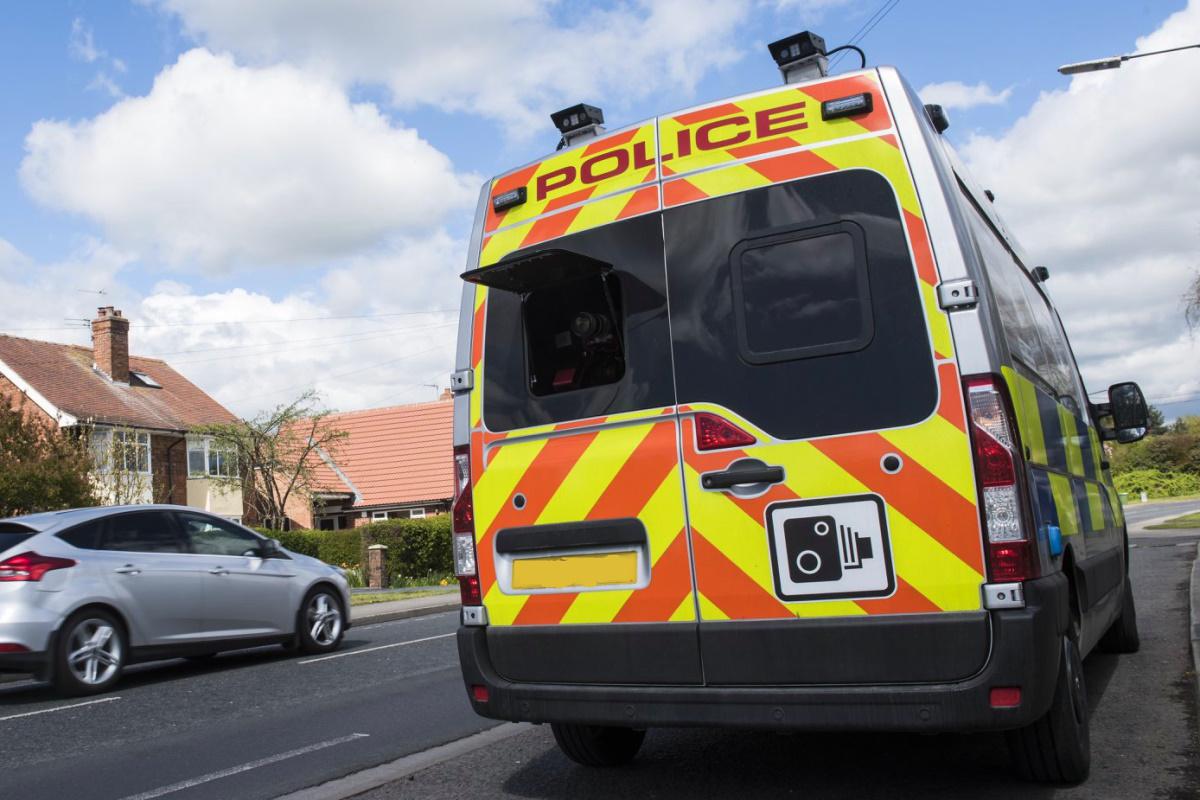
Analysis of UK speeding offence data ranks North Yorkshire as the third worst area for the number of speeding offences.
The study analysed the latest police force data from 2010 to 2020 on speeding offences for each region in England and Wales to establish where the speediest drivers commit their offences.
The data, analysed by the International Drivers Association found that Lincolnshire has the highest number of speeding offences with 5.43 per 1,000 people each year.
South Wales ranked second with 5.23 offences per 1,000 residents.
In third place is North Yorkshire, with an average of 3,774 speed limit offences per year from a population of 831,600, at an average of 4.54 speeding offences per 1,000.
|
Police force area |
Average number of annual speeding offences |
Number of speeding offences per 1,000 residents |
|---|---|---|
|
Lincolnshire |
4,164 |
5.43 |
|
South Wales |
7,030 |
5.23 |
|
North Yorkshire |
3,774 |
4.54 |
|
North Wales |
3,054 |
4.34 |
|
Dyfed-Powys |
2,266 |
4.33 |
|
Staffordshire |
4,816 |
4.23 |
|
West Yorkshire |
9,792 |
4.18 |
|
Lancashire |
6,088 |
4.02 |
|
Bedfordshire |
2,740 |
4.02 |
|
Cheshire |
4,157 |
3.89 |
At the other end of the scale, Durham has the fewest speeding offences committed on average each year, with just 0.95 per 1,000 people. The North East county also has the fewest total number of people being charged with speeding offences with just 609 on average each year.
Derbyshire has the second lowest number of speeding transgressions committed by drivers, at 1.24, with an annual average of 1,318 offences from a population of 1,064,000.
Wiltshire drivers receive an average of 921 speeding tickets each year, which equates to 1.27 offences per 1,000, the third lowest on the list.
Despite London having the greatest number of speeding offences overall at 13.973, the city has the sixth lowest rate (1.55/1,000) due to the greater number of drivers who live in the capital.
Commenting on the findings, a spokesperson from International Drivers Association said:
“This study offers a fascinating insight into the locations where drivers are more likely to put their foot down on the pedal and where more accidents may occur as a result. It will be interesting to see if these rankings change in the coming years as more schemes are implemented across the country to lower speeding limits in an effort to crack down on speeding violations.”
The IDA used the latest speeding offence data from data.police.uk spanning from 2010 to 2020 across each police force area in England and Wales to establish an annual average of speeding offences made. This was then cross referenced with population data from ONS in order to find the areas with the most speeding offences per 1,000 residents.

 Injured Yorkshire Coast Seal Back in the Water
 Flamingo Land Welcomes Baby Giraffe
 Scarborough and Whitby MP to Launch Petition for Return of Stroke Services
 UK Mayors Being Urged to Buy Scarborough Buses
 Free Music Events in Scarborough to Raise Funds for Andy's Man Club
 Scarborough's Cross Lane Hospital Receives Heartfelt Gift
 Saint Catherine’s Becomes First UK Hospice to Launch Masonic Aware Initiative
 Candidates Confirmed for First Scarborough Town Council Elections
 Scarborough Station Set for Multi-Million-Pound Roof Renovation
 Renewed Appeal Following "Shocking" Arson in Whitby
 Six Candidates Standing to Become First Elected Mayor of Hull and East Yorkshire
 Construction to Start on Whitby Maritime Hub


Comments
Add a comment