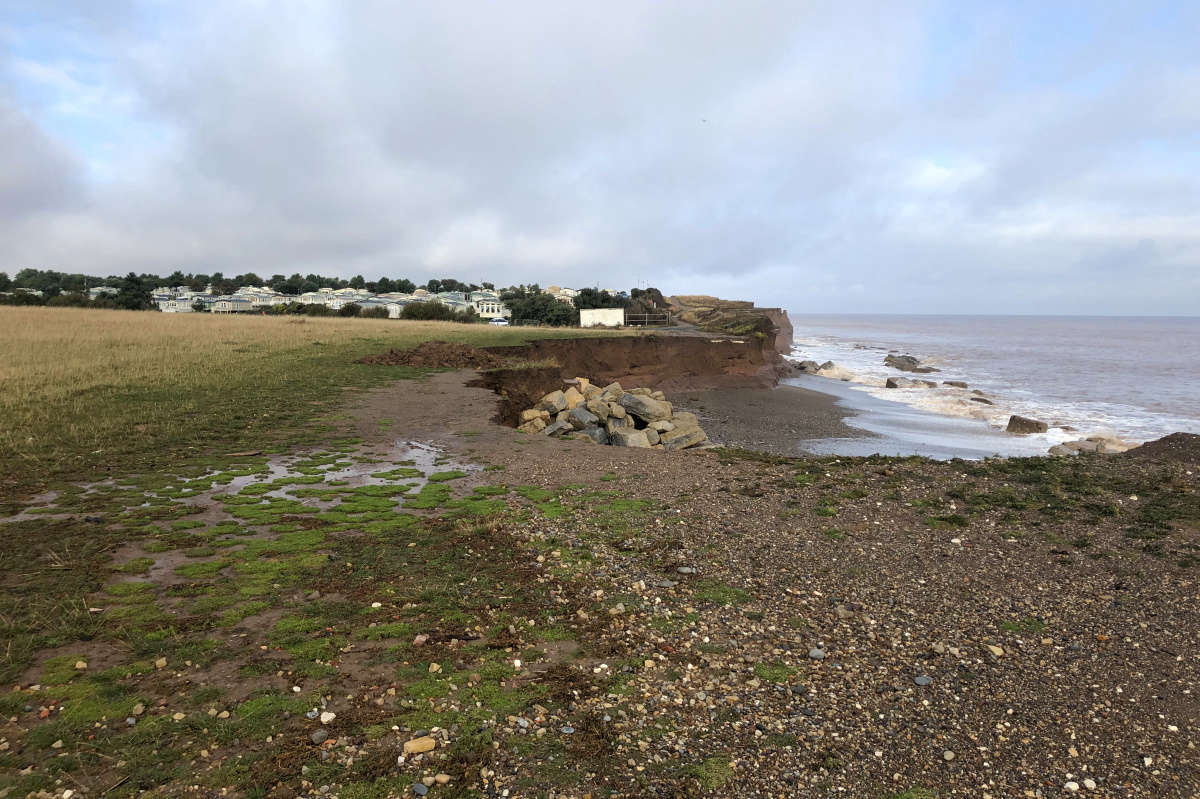
Climate change is having an impact on Coastal erosion on the Yorkshire Coast.
The latest figures show that there has been an increase in the rate of coastal erosion over the last 10 years with coastal towns including Bridlington, Hornsea and Withernsea showing varying degrees of erosion.
More frequent and heavier storms are accelerating the fall of waterlogged cliffs into the sea. Increased storms are also affecting the sea which then lashes against the base of the cliffs, weakening the structures still further.
Richard Jackson is the East Riding's Coastal Change Manager, he says the data shows increasing erosion rates for the East Riding.
The latest data shows parts of the East Yorkshire Coast are receding by up to eight meters a year.
Studies conducted in autumn 2022 and spring 2023 showed that erosion losses recorded over this period were generally slightly above average rates, however large regional differences were recorded,with some locations seeing negligible erosion and other areas experiencing significant losses.
Locations that saw higher than usual erosion include Fraisthorpe, Ulrome, south of Hornsea and areas to the south of Withernsea which continued to experience rapid coastal erosion, consistent with that seen over the past 10 years.
Richard Jackson is East Riding Council's Coastal Change Manager he says there are already projects underway to provide advice to communities and businesses.
Cliff Erosion Losses March 2022 to April 2023
| Location | Average erosion rate since 1989 |
Cliff losses March 2022 to Oct 2022 |
Cliff losses Oct 2022 to April 2023 |
Length of coast |
|---|---|---|---|---|
| Withernsea to Holmpton |
4.27m/yr | Substantial losses of between 4 and 8m over full length |
Substantial losses of between 4 and 8m over full length |
3.85km |
| MOD Cowden to Monkwith |
2.70m/yr | Average erosion rate with a few larger losses up to 6m |
Average erosion rate with a few larger losses up to 6m |
10.72km |
| Hornsea to MOD Cowden |
2.31m/yr | Minimal losses | High erosion rate through frontage, numerous losses up to 8m |
5.40km |
| Kilnsea to Spurn | 2.13m/yr | Minimal to normal erosion rates for the area |
Approx. 5.5m lost over full frontage |
0.65km |
| Tunstall to Waxholme |
1.97m/yr | Minimal to no losses | Average erosion rate with a few larger losses up to 4m |
2.50km |
| Monkwith to Tunstall |
1.88m/yr | Average erosion rate | Average erosion rate with numerous isolated losses between 5 and 8m |
1.50km |
| Waxholme / north Withernsea |
1.61m/yr | Average erosion rate | Average erosion rate with several larger losses |
1.0km |
| Easington to Kilnsea |
1.53m/yr | Minimal to normal erosion rates for the area |
Minimal to normal erosion rates for the area |
4.56km |
| Barmston to Ulrome |
1.33m/yr | Minimal to no losses | Minimal to no losses | 2.15km |
| Holmpton to Easington |
1.26m/yr | Minimal to average erosion rate |
Average erosion rate with several larger losses up to 8m |
4.05km |
| Ulrome / Skipsea |
1.20m/yr | Average erosion rate with several larger losses up to 4m. No change at Green Lane |
Average erosion rate with several larger losses up to 6m. No change at Green Lane |
3.75km |
| Fraisthorpe to Barmston |
1.13m/yr | Average erosion rates | Average erosion rates | 2.61km |
| Skipsea to Hornsea |
0.95m/yr | Minimal to no losses | Average erosion rate | 6.18km |
| Flamborough to Fraisthorpe |
0.50m/yr | Minimal to no losses | Several large losses at Fraisthorpe, up to 4m |
25.0 km |



 Scarborough and Whitby MP Supports New Coastal Communities Minister
 Scarborough School Uniform Giveaway
 Stephen Walker Bags Hattrick As Scarborough Put Four Past Marine
 Whitby Town Out Of Bottom Four After Last Gasp Drama
 Scarborough Rugby Celebrate Best Finish- Hornsea Promoted
 In-Form Brid Shock Promotion Chasers
 Pickering Town End Season All Square
 New Local Plan For East Riding
 Pickering School Wins National Accolade
 Charity’s New Filey Holiday Home Will Support Yorkshire Families
 Health Chief Reports Teen Bullying Worries in North Yorkshire
 Injured Yorkshire Coast Seal Back in the Water


Comments
Add a comment